
An article published today in the Guardian, written by Antonio Voce and Peter Walker, reports on a study carried out by Rachel Aldred and her team showing, contrary to the claims of many opponents, that low traffic neighbourhoods (a.k.a. LTNs, Active Neighbourhoods, filtered neighbourhoods, and liveable neighbourhoods) in London do not favour the well-off at the expense of the deprived; quite the opposite, in fact.
As it happens, we currently have a consultation here in Bolton on a proposed active neighbourhood scheme: the Oldhams Area active neighbourhood, funded by the Greater Manchester Mayor’s Walking and Cycling challenge Fund. It just happens to be right next to one of the existing low traffic neighbourhoods that we identified in our survey of modal filters in the borough. These two areas are shown in the map below, outlined in magenta, with actual and potential rat-runs marked. The through-routes that have been filtered are marked by a green dashed line, whilst those that have not been filtered are marked by a red dashed line. The red roundels show modal filters that look to have been added to roads after the original construction to prevent rat-running by motorists. The proposed new active neighbourhood can be seen to the south-west of Belmont Road.

The existing low traffic neighbourhood lies just across the main road from the proposed scheme. As is often the case with these existing low traffic neighbourhoods, it was never trumpeted as such. Nevertheless it has all potential through-routes filtered using kerbs and bollards to eliminate rat-running by motorists between two main roads. The images below show two of the modal filters that are already installed in this neighbourhood; these residential streets are relatively quiet as a result.


The proposed active neighbourhood already contains some streets that have been filtered, in one corner close to the major junction at Astley Bridge, to prevent otherwise very serious rat-running between Moss Bank Way and Belmont Road. The following image shows one of these, on Broad O’th Lane.

Unfortunately, those have led to other routes being used by motorists wishing to avoid the junction, including the still open rat-run from Sharples Park to Wilkinson Road on the left of the area in the map. As with all LTN proposals, however, there is resistance to the introduction of filters, and I felt that the councillors present at a recent consultation meeting seemed at best lukewarm to the idea.
In the light of the research in London that I referenced at the beginning of this article, it seemed very appropriate and timely to look at some of the demographics of the areas concerned. Apart from anything else, it may say something about why there might be such a disparity between the willingness of the council to filter streets in the existing “LTN” whilst being reluctant to do the same for residents in the proposed one.
First, I look at the Multiple Deprivation Index, which is an index of the levels of deprivation based on a number of measures. The map shows the ranking of the areas delimited by the Lower Super Output Areas used in the census, with the most deprived areas darkest and the least deprived areas lightest.

Based on this index, the majority of the existing “LTN” is in either the least deprived 10% or the least deprived 20% of the our borough and all of those neighbouring it. The majority of the proposed active neighbourhood, on the other hand is in the most deprived 20% or the most deprived 30% of the same area, with the area on the west side of that neighbourhood, which suffers most from rat-running between Moss Bank Way and Belmont Road, in the second decile (most deprived 20%).
Second, it is worth looking at levels of car ownership in the two areas, which turns out to be very revealing. The map below shows the proportion of households that did not have access to a car or van at the last census. Whilst this is quite old, there is good reason to believe that it still applies.
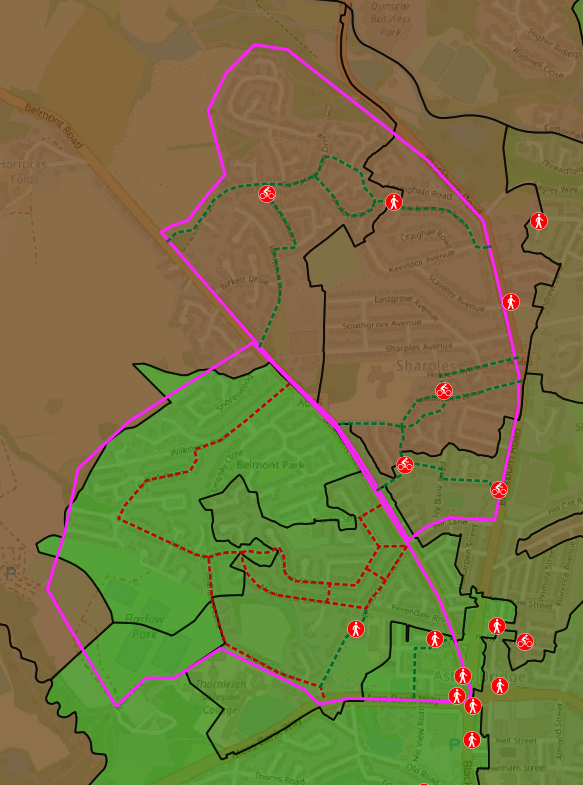
The brightest green in the map shows areas where 37% of households do not have access to a car or van (“car free”), whilst the darkest brown shows where this figure is around 5%. There is a distinct irony in the fact that the area with the lowest car ownership has so far received the least attention from the council in relation to the unpleasantness of rat-running through the places where they live. Hopefully this will be addressed by the new project.
It is clear that, in this case, the implementation of a new active neighbourhood (LTN) by filtering rat-runs would remove an injustice that already exists. Low traffic neighbourhoods are in fact nothing new, as you can see from our Ideas With Beers talk from January, but it is clear from this example that new ones can go a long way towards eliminating unfairness in the way residents are treated.